Loves Data’s Analytics Conference is one of the highlights of the Australian search marketing conference calendar. This year marked the second time I’d attended this magnificent event, after thoroughly enjoying last years’ speakers, as well as the 720 Km drive from Adelaide to Melbourne with my SEO mentor Woj Kwasi, I couldn’t resist the lure of heading back for another taste.
Last year the unequivocal highlight of the event was coming face to face with my Analytics hero and Google Analytics Evangelist, Avinash Kaushik. For me nothing could top meeting the colourful and charismatic Avinash, but I have to admit, when I saw Loves Data had teed up Jim Sterne – Founding President of the Digital Analytics Association – as the 2015 keynote speaker, they had me hook, line and sinker.

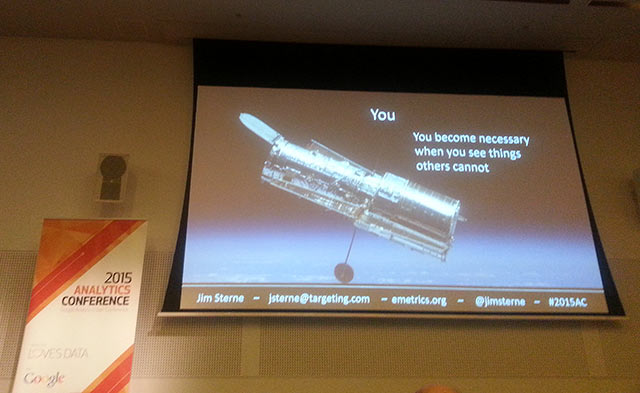
Jim Sterne – Keynote Speaker
eMetrics Summit Founder and Digital Analytics Association Founding President and current Chairman
Described as “the Don of Web Analytics” by Loves Data, Godfather of digital data Jim Sterne was the obvious choice for keynote speaker for this year’s Analytics Conference. As chairman and founding president of the Digital Analytics Association, founder of the eMetrics Summit, consultant to Fortune 500 companies and author of several books, Jim has over 20 years experience in online marketing measurement and digital analytics. Jim’s amusing and highly engaging talk about “how to become indispensable” as a data analyst was a great way to kick off the conference, and left us all licking our lips in anticipation for the day ahead.
The Key Takeaways from Jim’s talk:
1. Understand the Raw Materials (Data Sources)
Living in the age of big data means that we now have access to more data than ever before. As search marketers we need to be aware of the available data sources at our disposal, and select the sources that we use based on the particular project we’re working on. For some projects social and mobile metrics may be incredibly relevant, but for others they might not be. Be aware of all of your data source options, and form the measurement strategy that makes the most sense.
2. Understand the Tools
With so many tools available, we need to understand how each data gathering tool can best serve our needs. Only once you understand the purpose of each tool will you be able to properly use that tool to help you with your data gathering efforts. By improving your competencies in big data management tools you will come to understand the value that each tool presents.
3. Understand the Problem to be Solved
Ask questions and identify the objective of your reports, and make sure that you’re always thinking of your audience when you’re reporting. Analytics without goals is narcissism. Focus on the big picture and make sure you understand the problem you are trying to solve.
4. Understand the Art of Analysis
With so many models available for analysis we need to choose the ones that are useful, as all models are wrong. All models will provide us with questionable data, so it is important to make sure that you clean your data before analysis. Focus and direction are needed to effectively analyse big data. Start by performing a self assessment to identify your digital analyst competency, then use your creativity to analyse the following:
- Always check for patterns
- Always look for anomalies
- See what can be omitted
- See what would happen if you performed the same task backwards
- Ask what would happen if you changed the time scale
- Ask what additional data could be potentially revealing

5. Understand the Art of Communication
Help individuals achieve their goals with useful insights and recommendations. Don’t just deliver reports, use your data to tell stories. Top management want to know how your reports tie into the bottom line/goal of the work you’re reporting on. Don’t just report raw numbers, leave off the ‘sausage making details’ and tie all of your findings back to the bottom line.
“Averages are useless! If I have one foot in a bucket of boiling water and one in ice water, on average I’m fine” @jimsterne #2015AC
— Moe Kiss (@MoeMKiss) September 11, 2015
Jim’s Recommended Tools and Resources:
- Digital Analytics Maturity – For Digital Analytics Self Assessment
- Target Marketing – Jim’s Website
- eMetrics – To know what’s happening in the world of Big Data
Download Jim’s presentation from the 2015 Analytics Conference resources page.
Krista Seiden
Google Analytics Advocate
Analytics expert Krista Seiden brings to the table an impressive background in the digital analytics industry, having worked at both Adobe and The Apollo Group before taking up her current role as Analytics Advocate at Google. With Analytics education and training falling under her umbrella of responsibilities, Krista was the obvious choice to enlighten attendees on how to conduct the kind of testing that will help to create great web design.
Krista’s presentation focussed on the importance of exhaustively testing key elements of your designs before launch, and walked through the process of effectively executing these tests. She keenly demonstrated how vital testing is in order to help you with your conversion rate optimisation, and shared some of the real tests Google have conducted in the past.
The Key Takeaways from Krista’s talk:
1. Get Your Team Involved
Collaboration is key. Bringing your team together so that everyone feels involved, and getting inputs from them in order to generate as many ideas as possible is vital when it comes to testing.
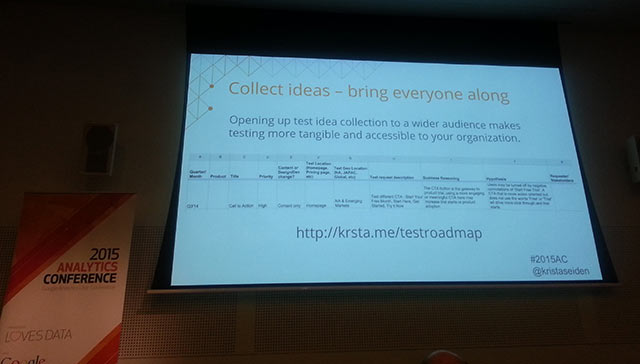
2. Build a Testing Roadmap
Building a testing roadmap does a lot more than simply outlining your testing program’s direction. It will help you achieve actionable things, help you move towards clear and well defined goals, and connects your testing to other areas of the project. She shared this great A/B testing roadmap spreadsheet to assist us with our roadmap testing.
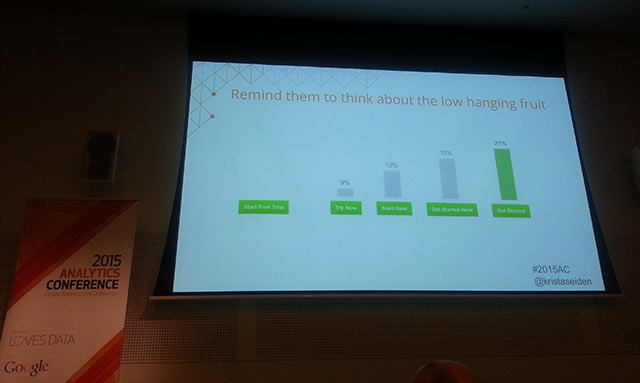
3. Do Testing
Prioritise your tests so that you capture the ‘low hanging fruit’ early on. Even simple changes to elements like call to actions will help you increase conversions. She shared this useful shopping cart CTA testing template to help us test our designs.
4. Check Results
Check your results and inform your whole team of your conclusions; always share your enthusiasm for testing with your team, as excitement is highly contagious. Wait for at least 30 days before pushing your test live, and remember, success doesn’t happen overnight.
Krista’s Recommended Tools and Resources:
Simo Ahava
Senior Data Advocate, Reaktor and Google Developer Expert for Google Analytics and Google Tag Manager
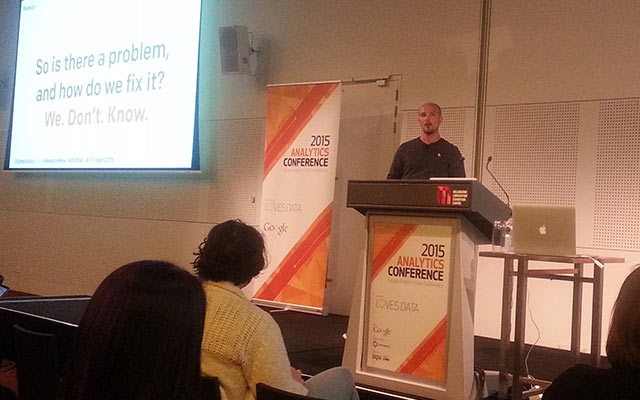
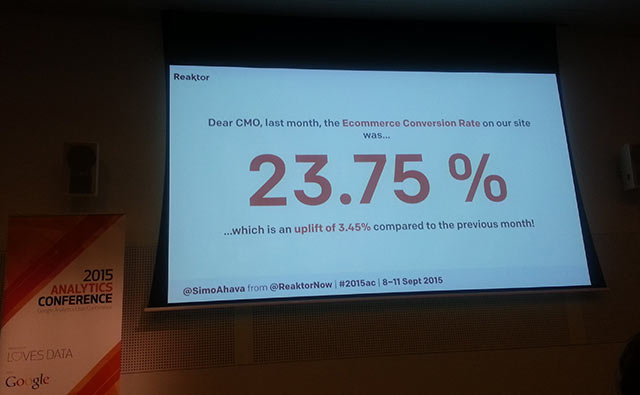
Simo Ahava’s presentation was a conference highlight for me, as he had everyone thinking about Google Analytics in a completely different way. He spoke on the topic of ‘Ambitious Analytics’ – a term he’s coined to describe the process of understanding how Google Analytics works and using it to your advantage to ensuring that the data you’re collecting is as relevant as possible. His bottom line? Google might be clever, but nobody (robot or human) understands a business’ goals like the business itself.
The Key Takeaways from Simo’s talk:
1. Avoid the Curse of Plug & Play Metrics
We tend to use Google Analytics without actually understanding how it works. We simply perform a default set-up and then report the numbers without properly understanding how the data is being collected and reported. Don’t do this, it’s up to you to ensure that the data you’re collecting speaks to the outcomes that you’re looking to achieve.
2. Check the Quality of Data in GA
Data quality is directly proportional to how well you understand the data collection mechanism.
Stay away from the aggregate metrics, data must be collected and represented in a meaningful way. Every business is unique so you should make sure that you know the unique objectives of each project that you’re working on, understand the data collection mechanism and get valuable, clean data from analytics. Simo demonstrated how even the most basic metric “sessions” is controlled by various events in Analytics.
Sessions can be defined as a “group of interactions that takes place on a website”, but the calculation of sessions in Google Analytics is influenced by several events that you need to understand before you can properly interpret your results e.g. cross domain tracking (unless implemented correctly), 30 minutes of inactivity, by session control parameter, etc.
This is why analytics consultancy takes more and more of my budget each year! @simoahava #2015AC pic.twitter.com/Wln6mHSS3p
— Becks (@OzBeaker) September 11, 2015
3. Track “Form Abandonment with Google Tag Manager”
If you’re looking to track form abandonment use Google Tag Manager (GTM), because form abandonment isn’t as clear cut as many of us think. “Form abandonment isn’t always easy to define. Most often, it refers to when someone starts to fill in an HTML form, but leaves the page without submitting it. As a definition, this works nicely. However, with multi-page forms it naturally refers only to the last page of the form,” said Simo.
Simo has an excellent post about how to setup and track “form abandonment” in Google Analytics using GTM.
4. Learn & Understand JavaScript (JS)
Understanding JavaScript is necessary for everyone working in the digital analytics space, as it’s key to helping you unlock the power of Google Tag Manager (GTM). You don’t need GTM training, you need training in JS because GTM uses JS. I was a little unsure about this point, but luckily for me Simo was kind enough to clarify by replying to my tweet:https://twitter.com/SimoAhava/status/642163479630123008
Simo’s Recommended Tools and Resources:
- Simo’s Blog – Great resources for GTM/GA
- www.codeacademy.com – For anyone who is willing to learn coding
Download Simo’s presentation from the 2015 Analytics Conference resources page.
Lea Pica
Analytics, Data Visualization, & Presentation Consultant, LeaPica.com
Lea Pica hammered home a harsh lesson in her presentation – whilst we’re excited by data in all its many weird and wonderful forms, this doesn’t necessarily mean that our audience shares our passion. Lea spoke to us about presenting data in a way that engages audiences. Her bottom line was the following simple, yet easily forgotten, recommendation: put yourself in your audience’s shoes and consider what’s important to them when you are reporting.
The Key Takeaways from Lea’s talk:
1. Be your audience
Like Jim Sterne said in his keynote, it’s important to place yourself in your audience’s shoes when reporting. Always ask yourself the question “what’s the purpose of this report?” Then tell a story with your data that intrigues, rather than intimidates, your audience.
2. Maximise Data Absorption
Pay close attention to formatting and visual representations to ensure that your presentations are as eye-catching as possible. Include interesting and relevant imagery within your reports in order to maximise data absorption. When you include images within your presentations, recall after 2 days improves by up to 600% as opposed to text only reporting, since as we all know, images stir our emotions.
3. Know your presentation
Know your presentation inside and out before you present it to your audience. Remember: you, not your PowerPoint, are your presentation. Understand your material, be confident in your findings, and present with personality, and you’ll help maximise your audience’s data retention.
Death by Powerpoint… It’s not a ppt problem, it’s a people problem @LeaPica #2015AC
— Krista Seiden (@kristaseiden) September 11, 2015
Leas’s Recommended Tools and Resources:
- Juice labs chart chooser – Charts for presentations
- http://www.leapica.com/betterbullets – Lea’s Blog
- Book – Presentation Zen by Garr Reynolds
- Book – Brain Rules by John Medina
Download Lea’s presentation from the 2015 Analytics Conference resources page
Benjamin Mangold
CEO and co-founder Loves Data
One of our final presentations for the day came from Loves Data CEO and co-founder, Benjamin Mangold. Benjamin spoke about our careers in digital analytics, and the way that digital analytics can be incorporated into any job role. He also spoke specifically about the model he’s created to help Google Analytics enthusiasts build careers as experts in their field. This framework outlines a four-step process: play, learn, mentor, and refresh.
The Key Takeaways from Benjamin’s talk:
Forging a Career in Analytics
Ben used the below model to leverage our strength to learn and become Google Analytics experts.
PLAY > LEARN > MENTOR > REFRESH
1. Play
Make time to explore Google Analytics, and don’t be afraid to experiment and fail. Dedicate at least a couple of hours each day to experimenting and exploring its myriad capabilities and functions.
2. Learn
Make use of both free and paid course to learn and enhance your Google Analytics knowledge.
3. Mentor
Once you’ve played and learnt about Google Analytics, share your knowledge with your peers via blogging, article writing, and thought leadership.
4. Refresh
As always it’s important to refresh your knowledge. We should never remain stagnant, and as Google Analytics evolves, we too must evolve as practitioners. In order to become experts we should constantly follow this cycle, and always be looking to refresh our knowledge.
Benjamin’s Recommended Tools and Resources:
- Coursera – Free online courses
- Mob Lab – A series of peer learning sessions with Greenpeace staff from across the globe that focus on a variety of organising and technical topics
- Analytics Academy – Google’s free online Analytics training
Download Benjamin’s presentation from the 2015 Analytics Conference resources page.
Conclusion
Analytics Conference 2015 has equipped me with a wealth of valuable and actionable tips; insights that I’m just dying to implement as part of my work at Kwasi Studios. The conference opened my eyes to the importance of understanding the extensive capabilities of Google Analytics, and the need to experiment with its vast functionality. As search marketers we must tailor the way we collect and use data for each client and/or project, as well as understanding our audience. Furthermore, we must tell a story when presenting our data to clients, as this adds considerable value to our reporting efforts.
With Analytics Conference 2015 over and done with for another year, everyone here at Kwasi Studios has already turned their attention to next year’s conference, where the prospect of none other than Mr. Rand Fishkin, the Wonderful Wizard of Moz, delivering the keynote address has left us thirsty for more.
Yet another reason to be excited for next year… @randfish will be coming! #2015AC #2016AC
— Loves Data (@LovesData) September 9, 2015
Will you be joining us (and Rand) at Loves Data’s Analytics Conference 2016?

Comments (0)